Showing posts with label wwDam. Show all posts

Logan Martin Dam near Alpine, AL

(Satellite)

Photo from TooneCycling
[It amazes me that fish can go through the pentstock, scroll and turbine and still have enough energy to feed off a fisherman's line. Or does the turbulence attract fish from downstream?]
Fishing and Boating Safety Tips
Steve Robinson posted ten photos with the comment:
Alabama-Logan Martin Dam
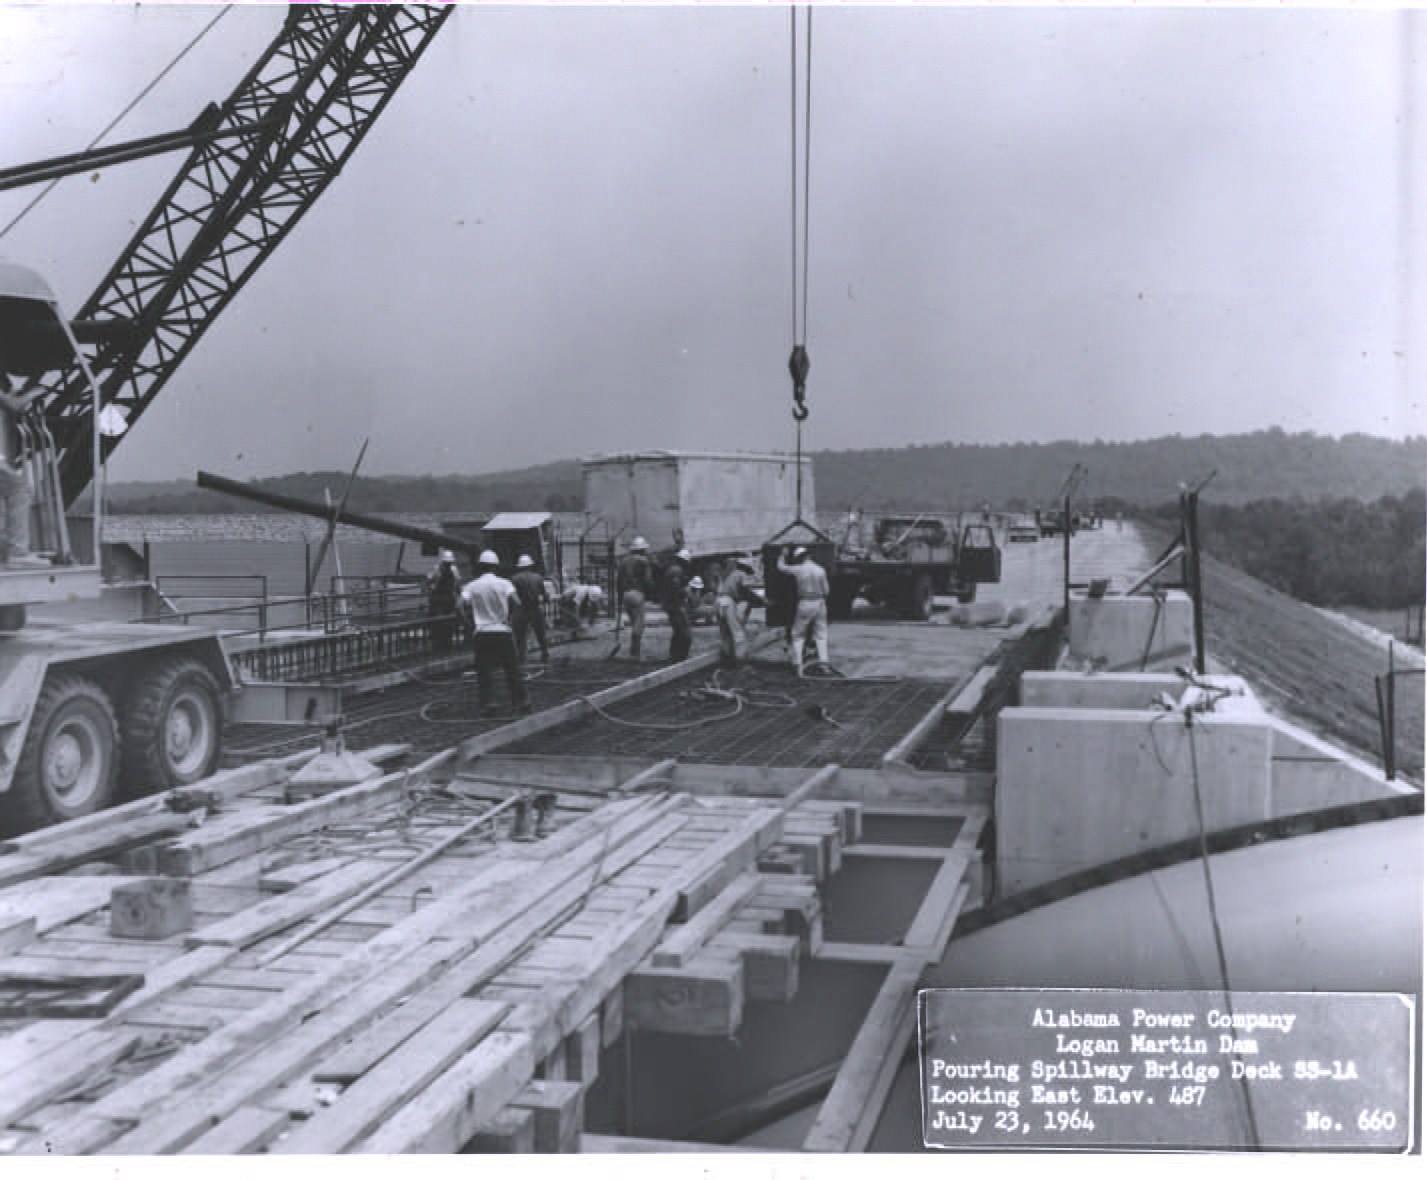
Construction of Logan Martin Dam began in 1960 and quickly took on the monumental scale of an ancient wonder. Photos from Alabama Power’s Archive show hard-hatted workers dwarfed by gigantic intake pipes and turbine housings. Against the dam’s massive flanking earthworks, trucks and cranes seem like toys in a sandbox. Even a half-century later, these images can inspire awe at what it took to tame a river and turn pent-up water into electricity.
An annual festival and boat show at Pell City’s Lakeside Park. Named for former Alabama Attorney General Logan Martin (brother of longtime Alabama Power President Thomas Martin, for whom Lake Martin is named), the dam created a 48.5-mile-long reservoir 460 feet above sea level (465 in summer), with 275 miles of shoreline and an area of 15,263 acres. The dam is 459 river miles above Mobile. Its concrete section, longer than two football fields [612 feet], houses three turbines powering AC generators that produce more than 400 million kilowatt-hours per year.
Beyond hydropower, the dam provides flood control, economic development, irrigation and drinking water, fish and wildlife habitat, and recreation. Flowing under the Interstate 20 bridge east of Pell City, the lake is a liquid interlude on the drive between Birmingham and Atlanta.
Motorists crossing that causeway have been known to feel a pang of envy at the sight of a fast-moving water-skier or a fisherman angling for bass.
Logan Martin was part of the second great phase of hydroelectric dam-building in Alabama. The first era, starting with Lay Dam (completed in 1914) and ending with Thurlow Dam (1930), gave us Lay, Jordan, Mitchell, and Martin lakes, among others. But after the early dams were built on the Coosa and Tallapoosa rivers, the Great Depression and World War II intervened.
The damming of the entire Coosa River had long been envisioned (in the 1870s, the first of many surveys authorized by Congress recommended no less than 34 dams and locks for the river). Finally, in June 1954, President Eisenhower signed into law legislation the U.S. House and Senate had approved almost unanimously, authorizing the transformation of the upper Coosa as proposed by Alabama Power. Logan Martin Dam was the second dam built under the project, which included the construction of Weiss, Henry, and Bouldin dams and the redevelopment of Lay Dam to increase its generating capacity.
A half-century is a long time, but older locals remember what the area was like before the waters rose. “I had family here and came here as a boy,” said Mike Riley, president of the Logan Martin Lake Protection Association. “This was a largely rural, agricultural community. The Coosa was a fast-moving river, not something you’d just jump into.”
It had flooded for generations, as noted by Native Americans who lived on the Coosa and observed that every 15 or 20 years the Coosa “overflow[s] the banks, and spreads itself for five and six miles in width.” [From “Rivers of History” by Harvey Jackson, p.2]
To clear the way for the lake, Alabama Power had to compensate people for property, cut down thousands of trees, and relocate more than 2,000 graves. The lake inundated the village of Easonville, established in 1821.
“I was a teenager when the lake came,” said Pell City resident Vicki Davis Mize. “We lived in Easonville, on what is now Harmons Island. My mother’s store was covered by the water but my father’s church was moved to higher ground.” This structure, Coosa Valley Baptist Church, now stands beside Highway 231.
“A lot of us were very sad to lose our homes,” Mize said. “But farmers who were struggling were better off after selling land to the power company.”
“From a P.R. standpoint, Logan Martin was a much easier sell than the earlier lakes,” said Harvey Jackson, a professor emeritus of history at Jacksonville State University who has written extensively on Alabama waterways. “By then, Alabama Power knew how to hash out the problems. People knew lakefront property was valuable and the lake benefited from its proximity to Birmingham. Because of the dams, the Coosa today is really more of an elongated lake than a river. They were built for electricity but have turned out to be one of the greatest recreational assets the state has.”
Pell City resident Carol Pappas has lived on Logan Martin for about 30 years. “The lake had the effect of growing the surrounding towns — Pell City, Talladega, Lincoln, Riverside, and others — and improving the local economy and housing. We have a lot of people in Georgia with lake homes here,” she said.
“I never pitched the community without highlighting the lake,” noted former Pell City Mayor Guin Robinson. “I can’t tell you how many lake cruises we’ve had with visitors thinking of relocating. You’re not just relocating a business, you’re moving families.”
Robinson and others say the higher quality of life and lower electrical rates fostered by the lake and dam helped attract the Honda plant to Lincoln. “People recognize that the town and the region would not be what they are today without Lake Logan Martin,” he said.
Pappas agrees. “The quality of life of lakeside living is extremely positive — it’s like being on vacation all the time.”
“If you’ve spent time on a lake, you know it’s therapy,” Robinson said. “It has a way of calling you home.”

1

2

3

4

5

6

7

8

9

10
What struck me about this dam is the height of the Tainter gates. They are about half the height of the dam itself.

(new window)


Share:

NYC water supply: Cannonsville Dam sprung a leak

(Satellite, the spillway is a text book example of a tumble bay)

Cannonsville Dam is the westernmost dam in NYC's water supply, and it captures water from the Delaware River, which flows through Trenton, NJ and Philadelphia, PA. "Placed into service in 1964, Cannonsville Reservoir was the last of New York City’s 19 reservoirs to be built. Water diverted from Cannonsville Reservoir for drinking water enters the West Delaware Tunnel and travels 44 miles to the upper end of Rondout Reservoir. From there, it is carried in the 85-mile-long Delaware Aqueduct. Water is released downstream from Cannonsville Reservoir under the terms of the 1954 U.S. Supreme Court Decree, and a flow program, known as the Flexible Flow Management Program, agreed upon by New York City and the states of Delaware, New Jersey, New York and Pennsylvania. All other reservoirs in the city’s Delaware System have continued to meet their downstream release requirements under the Flexible Flow Management Program while the condition at Cannonsville is repaired."  [Aug 2] It holds an eighth of the system's water supply. [NYtimes]

Cannonsville Public Meeting, page 3
New York City Department of Environmental Protection
It is a 175' tall earthen dam that can store 95.6 billion gallons with a two-stage emergency spillway that is 800' long.

(When this photo was taken, I wonder if the river release was kept low to deliberately fill the reservoir to test the spillway or if there was a spring season wet enough to cause the overflow.)

Cannonsville Public Meeting, page 4
If I'm reading the diagram below correctly, water will start going over the spillway at an elevation of 1150'; and, at the maximum expected spillway flow, the water level would be 1155'. So the water should remain 20' below the height of the dam.

Cannonsville Public Meeting, page 5
Soil sample bore holes were drilled as part of a study to build a 14Mw power plant next to the existing release chamber. (It is interesting that the above diagram of the dam doesn't include the intake for, and location of, the discharge pipe to runs to the release chamber. This pipe the normal way of releasing water so that the reservoir level should seldom reach the emergency spillway.)

Cannonsville Public Meeting, page 8
If you look at the dam diagram, you see by the "Assumed rock surface" graphic that they don't even know where the bedrock is for this dam. It is built on glacial till. So before they build the hydro-power plant, they need to understand what type of soil+rock mixture is under it so that they can design the pilings needed for the foundation. They do this by boring holes to sample what is underneath. One of the holes created an artisan spring under the rock drainage at the tow of the dam. What I can't tell is if that was expected and they normally then plug the rock drainage with Bentonite or if this spring was a surprise and their efforts to plug it with Bentonite failed. Now they have Bentonite and bore hole material flowing with the water through the rock and into the river.

Cannonsville Public Meeting, page 10
Evidently the booboo was on July 8 and the presentation to the public was July 23. While they are working on repairs, they have maximized the release to the NYC water supply at 970 MGD and maximized the river diversion at 470 MGD. They are also "stockpiling materials and equipment for emergency on-call repairs." [Cannonsville Public Meeting] This is lowering the water level about 8 or 9 inches a day. It has raised the Delaware River about a foot and reduced the water temperature, which is good for the trout. [WaterShedPost]
They have also released the inundation map to the public even though it is marked "FOR OFFICIAL USE ONLY - NOT FOR DISTRIBUTION." This map indicates the impact of the worse case scenario of a breech with a full reservoir. It is not surprising that the whole town of Deposit would be under water. It is surprising that several blocks and bridges in Philadelphia would also be under water.

The photo below shows the water turbulence in the release chamber caused by the maximum release flow and the turbid water to the left caused by the aquifer puncture by the boring hole. You can see a relief-well drilling rig on the upstream side of the road at the base of the dam.

The repair has two stages. The first is to drill relief wells upstream with proper screens and casings so that clean water will flow through the rock embankment. These clean holes will relieve the pressure on the dirty holes and stop the release of sediment into the river. The second stage is to grout the soil sample holes and then drill grout holes around the dirty holes to create a grout curtain with pressurized grout. [July 23]

nyc.gov Flickr

nyc.gov Flickr
One of the two rigs drilling the relief wells.
By July 29, a sediment analysis was complete. It determined that the sediments are coming from the bore hole site and not from the dam. When the first relief well started flowing, the turbidity in the river was reduced. So the relief plan was working. "Engineers are prepared to install as many as 8-10 relief wells, but they expect it may take fewer to end the turbid discharge." [July 29]

Four relief wells were enough to stop the turbid flow, and outflow rates started to shift to normal rates on July 29. In this case, normal was zero for drinking water because they switched to other reservoirs for drinking water to reduce the rate this reservoir was being drained. The river flow was reduced from 1500cfs to 500cfs between Aug 2 and Aug 5 per the advice of fisheries biologists. Inflow was 300cfs. At the time of the July 23 presentation, the water level was 1141.97' with 47.2 billion gallons of warm water and 37.5 BG of cold water. As of Aug 2, 25 BG of cold water remained. (I never found information on how much warm water was left. Nor if the water intake has inlets at different levels to control the temperature of the water that is released.) [Aug 2]

The second stage of repairs was finished Aug 21. Now they will gradually close the relief wells and verify that the dam's instrumentation shows values returning to levels comparable to what they were before the test bore holes were drilled. [Aug 26]

After two weeks of monitoring the instrumentation and the flow in the river, the repairs have been declared successful. The reservoir is expected to fill to normal capacity by late Spring, 2019. [Sep 17]

nyc.gov Flickr
"This photo shows the cloudy discharge downstream of the dam just a few days after it was discovered."
[It also shows the turbulence in the release chamber with a high release rate. In hindsight, the dam was not in danger and they did not need to release the water. But it makes sense that when there is a sign of trouble that they would drain first and think second. Nonetheless, it did take a week before they decided to start draining the reservoir even though it was close to capacity because of a wet June. [NYtimes]]

nyc.gov Flickr
"This photo shows the cloudy discharge after one relief well was installed and pumping. The discharge was reduced, but some remained along the grass and the stone abutment near the middle of the photo."

nyc.gov Flickr
"This photo shows the same area downstream of the dam on Aug. 7, after the cloudy discharge was successfully halted by the relief wells. Notice the water is so clear that rocks on the river bottom can be seen easily."
The 14MW ($2M per year) capacity of the proposed hydro-power plant is impressively small. Modern coal plants and nuclear plants are over 1000MW. 14MW is just a few windmills in a windmill farm. At an estimated cost of $72M, it was estimated that it would barely pay for itself assuming a 50-year lifespan. After this repair bill, it strikes me as a looser because of the risk of building a foundation over a pressurized aquifer.

Share:

WE Energies Dam on Pine River and Hydro Dams

(Satellite)  Note the long inlet channel to the powerhouse penstocks. It must have been rainy because the dam is spilling a lot more water than is going through the powerhouse.

Doug Kearney posted three photos with the comment:
Grove RT875E working on the Pine river dam for WE Energies in Florence, WI. A lot goes into setting it up. They had to haul the barge sections down the hill, launch them, then roll the crane on board. You can see the ramps on far shore. Driving the crane down the hill was probably a bit of an adventure.
1

2

3
"Near Florence" is relative. It struck me as being rather far away until I saw how few towns were in the area. I noticed that there are some bigger, closer powerhouses. And they also are spilling a lot of water.

Satellite
Satellite
I almost missed the powerhouse for this one because it is downstream, and I do not see an intake structure for the penstocks.

Satellite
Satellite
This reservoir needed some "helper" side dams.
So the Pine River Dam is one of WE Energies smaller reservoirs.


Share:

Calaveras Dam Rebuild

Satellite
After $823m and 7 years, this 1925, 220' tall dam has been rebuilt to safely store 31 billion gallons of water during earthquakes up to a 7.25 magnitude on the Calaveras Fault that runs 1500' away.

(new window) (source)


(new window) Possible failure due to a local fault line was identified in 2001.  It was supposed to cost half as much and be done in four years. (source) The reservoir has been kept below 40% capacity since 2001. [SFchronicle]


Almost before:
Screenshot
Almost after:
Screenshot, October 2017
When they started removing the side of the hill near the end of the time-lapse video, I was wondering if that was a planned borrow site or if they were reducing the risk of a landslide. I found my answer. Removing that hillside was evidently not part of the initial plan. "The reason for the delays? Once they started digging, construction workers found two ancient landslides in the 20 million-year-old geologic layer cake nearby, forcing them to carve away millions of tons of rock and sediment to better anchor the new dam on more solid footing. They also had to shore up hillsides more than expected, and were delayed three months during the flooding winter of 2016-17....Outside experts say the delays were an unfortunate, but unavoidable, reality." This is the largest of the five reservoirs that supply water to the Bay Area. "The clay core and other features of the new dam will allow it to be raised 150 feet some day, if future generations decide [They can decide how much they want to pay for steelhead trout and/or more water.], which would quadruple the reservoir’s size." This rebuild is part of a $4.8 billion earthquake hardening effort of the Bay Area's water supply initiated in 2002. Some people's water rates have tripled. "The project also gained attention after the roughly 300 workers began digging up huge teeth from Megalodon sharks 20 million years ago, along with hippo teeth, fossilized palm trees and whale skulls. They all were donated to the UC Berkeley Museum of Paleontology.
Before San Francisco was required to upgrade the Hetch Hetchy system, studies showed a major quake could cut off water for 60 days, causing significant health problems and fire risks. Now, the system is strong enough so that 70 percent of customers will have water within 24 hours after the Big One." [MercuryNews]

They not only had to lower the risk of new landslides, they added buttress fill to stabilize an existing landslide. [SFwaterFacts]

While looking at the time-lapse video, it appeared that they dug away part of the old dam to make way for the new dam. But the following explains they built the new dam a little downstream of the old dam. 
San Fancisco Public Utilities Commission
It is interesting comparing the initial rendering to a Spring, 2018 photo.
SFwater-Facts

SFwater-Facts
In the rendering, there seems to be essentially a cliff next to the base of the spillway. In 2018, not only is that cliff gone, a cover has been put on top of what remains. And notice that they did not merely step the left abutment, they significantly reduced the slope of the abutment.


I wondered why I could not see the end of the outlet empty into the stilling basin. Evidently the outlet pipe goes directly to the Sunol Valley Water Treatment Plant. The new dam has a new intake/outlet tower that is 20' in diameter and 163' deep. The input is a 72" steel-lined tunnel and the output is a 78" pipeline. [WaterTechnology] The treated water must be delivered to the Bay Area via an aqueduct. They want to make sure they don't loose a drop of the transported water to evaporation, etc. Even though the dam is 220', I can find no indication that they recover hydro power from the output.

A discussion of the inlet/outlet structures for the new dam mentioned three tunnels. It looks like they may now have an emergency outlet to the river in addition to the78" pipeline to the water treatment plant. Specifically, note the structure just to the left of the spillway base in this image.
PDF Zoomed
They did remove the old spillway, but at 40% capacity, it would not have been used since before 2001 anyhow. But they also removed the toe of the dam because they exposed the original outlet pipe.
Screenshot
They capped the old outlet pipe before they started rebuilding with layers of material.
Screenshot
The problem with a fast time-lapse video is that I did not catch them building the outlet pipe. They used the old stilling basin a couple of times before it was covered up.
Screenshot
When I read about a landslide somewhere else in California a few years ago, the article explained that, because of the many earthquakes, the bedrock was "incompetent." The article gave as an example that even the granite mountains can't be climbed using pitons because the rock won't reliably hold them. So I was not surprised that this project included 100' deep grout walls in the foundation and abutments. But I was surprised that building the spillway on bedrock was not sufficient. "Construction crews drilled 1,825 anchors approximately 25 feet into the rock around the spillway to provide support and prevent damage to the structure during a 7.25 maximum credible earthquake on the Calaveras fault." [SFwater-spillway] There not only was a landslide in 1918 when they were building the original dam [ucdavis], there was a landslide this year [2018] that closed the Calaveras Road! [SFwater Project Update] In contrast, the bedrock in Illinois is very competent. That is why we can feel earthquakes in Southern Illinois up here in the Chicago area.

I finish by firing up Global Earth and capturing images from 2011 to April, 2018

May 2011
Jan 2012
May 2012
Aug 2012
Jun 2013
Mar 2014
Nov 2014
Jun 2015
Oct 2015
Apr 2016
Aug 2016
Jan 2017
Mar 2017
Aug 2017
When I move the slider, I see times for 1/2018 and 2/2018; but when I release the mouse, the slider moves back to 8/2017. So I'm going to have to end with the last one currently displayed.

Apr 2018


Share:

Featured Post

Copper River & Northwestern Railway and its bridges

Mile 27, Flag Point Bridge: ( Satellite ; Blog ; more below) Mile 28: the bridge no longer exists; Blog Mile 34, Hot Cake Bridge: the bridge...